

We tell clients to treat their website like a storefront — clean it, maintain it, keep it fast. So when our own site started throwing a warning we didn’t like the look of, we did exactly what we’d tell any client to do: we stopped and actually looked.
What we found wasn’t dramatic. No hack, no crash, nothing broken on the surface. Just a slow, quiet performance problem that had probably been there for a while — the kind that costs you visitors without ever throwing an error.
The Warning That Started It
WordPress’s own Site Health tool flagged a critical issue: “Page cache is not detected and the server response time is slow.” We had a caching plugin installed and switched on — settings said “enabled,” dashboard looked green. Easy to assume that box was ticked and move on.
Instead, we tested it. Three fresh requests to the homepage, no cache allowed, timing each one by hand. All three came back in roughly the same 600-760 milliseconds — no improvement at all between the first request and the third. A working cache should make request two and three dramatically faster. Ours wasn’t doing anything.
The setting was on. The feature wasn’t working. Those are not the same thing, and the gap between them is exactly where a lot of “optimized” websites are quietly losing visitors.
Why the Cache Wasn’t Caching
Our caching plugin’s core page-caching feature only works if the hosting server itself runs specific server software it’s built for. Our hosting doesn’t run that software — so the plugin’s cache toggle had probably never done anything at all, on any hosting plan, ever. The other features (image handling, minification) worked fine independently. The one feature we actually needed most was silently inactive the whole time.
The fix: instead of depending on the hosting server for caching, we set up caching at the CDN level instead — a layer that sits in front of the site regardless of what the hosting server runs. Fresh requests still take the same time as before. But every request after that first one now returns in 20-24 milliseconds instead of 600-760. That’s over 95% faster, for every repeat visitor and every crawler that hits the site.
Then We Found the Real Problem
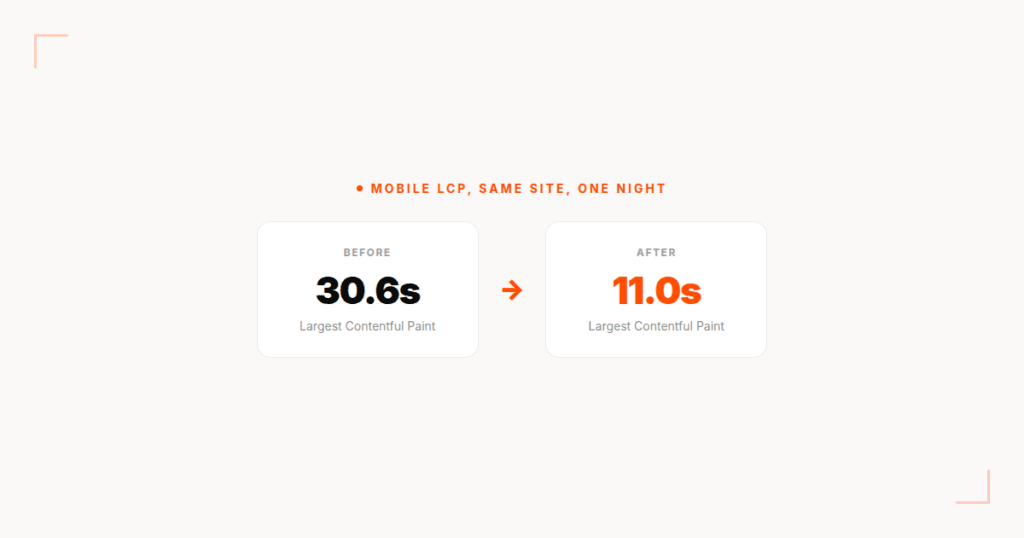
Fixing the cache was step one. Running a full PageSpeed Insights audit is what showed us the bigger issue: our homepage weighed 8,992 KB — nearly 9 megabytes — almost entirely from unoptimized portfolio photography. On a throttled mobile connection, our Largest Contentful Paint (the moment the biggest visible element finishes loading) came in at 30.6 seconds.
Thirty seconds. On a site that sells web design services.
The Fix: Let the Machines Handle It
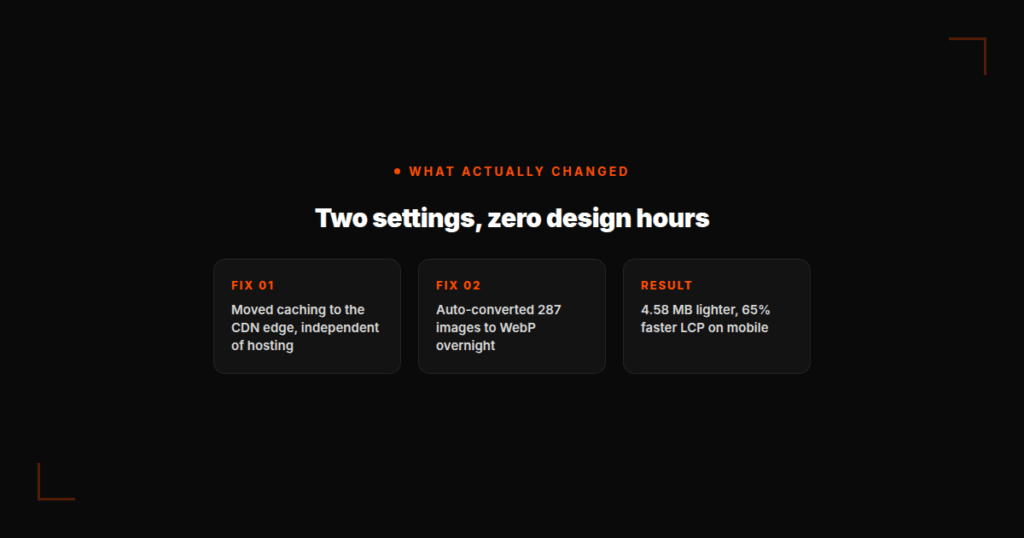
We didn’t touch a single image in Photoshop. Instead, we turned on automatic image optimization already sitting unused in our caching plugin — compression plus WebP conversion, a modern image format that’s typically 25-35% smaller than JPG or PNG at the same visual quality, run through the plugin’s cloud optimization service.
We queued it before finishing up for the day. By the next morning:
- 287 images processed and converted automatically
- 4.58 MB shaved off total image weight
- Zero manual editing, zero design time spent
The Results
We ran the exact same PageSpeed test again the next morning, same site, same homepage:
- Mobile LCP: 30.6s → 11.0s — a 65% reduction, overnight
- Desktop Performance score: 59 → 76
- Estimated image-related savings: 6,217 KB → 121 KB remaining
No redesign. No developer sprint. Two settings, switched on correctly, and a night of automated processing.
The Actual Lesson Here
This wasn’t really about caching plugins or image formats. It’s about a pattern we see constantly when auditing client sites: a setting that’s technically “on” isn’t the same as a feature that’s actually working. Plugins get installed, toggled on once, and never verified again. Nobody goes back to check — because on the surface, everything looks fine.
We only caught this because we tested our own assumptions instead of trusting a green checkmark in a settings panel. Most site owners never get the chance to find out — they just quietly lose visitors on slow mobile connections, with no error message to tell them why.
How Fast Is Your Site, Actually?
If you’ve never run your own website through a real performance audit — not a glance at a dashboard, an actual test — there’s a good chance something similar is happening on your site right now.
Get a free audit of your website →
We’ll test it the same way we tested our own — and tell you exactly what we find.